
Pharmacy Inventory Report – Mid-Year 2026
The pharmacy real estate sector continues evolving as operators adjust store footprints, expand healthcare services, and respond to margin pressure and changing consumer behavior.
B+E’s Mid-Year 2026 Pharmacy Inventory Report analyzes:
- Walgreens and CVS cap rates
- Pharmacy inventory levels
- Lease term trends
- Geographic concentrations
- Pharmacy pricing metrics
- Tenant performance
- Market shifts impacting investors
Download the full report for detailed pharmacy investment data and market insights.
Mid-Year 2026 Pharmacy Market Overview
The pharmacy sector remains heavily concentrated among Walgreens and CVS.
Current inventory includes:
Walgreens
- 284 properties on market
- Average cap rate: 7.87%
- Average price: $4.39M
- Average lease term: 7.1 years
CVS Pharmacy
- 123 properties on market
- Average cap rate: 6.88%
- Average price: $4.85M
- Average lease term: 9.8 years
CVS continues trading at lower cap rates than Walgreens, reflecting stronger perceived tenant positioning and investor confidence.
Why Are Pharmacy Cap Rates Rising?
Pharmacy cap rates have increased due to several sector pressures:
Store Closures
Large operators continue evaluating footprints and reducing underperforming locations.
Margin Pressure
Retail pharmacies face reimbursement pressure and operating cost increases.
Competition
Competition continues expanding from:
- Discount retailers
- Online pharmacies
- Amazon
- Walmart
- Alternative healthcare providers
These trends influence investor perception and pricing.
Download the Full Pharmacy Inventory Report
Access detailed pharmacy cap rates, inventory trends, lease structures, geographic concentrations, and tenant insights in the complete Mid-Year 2026 report.
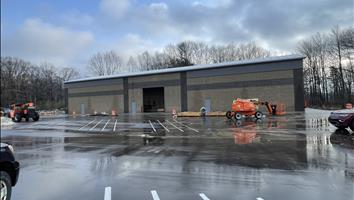
- $4,250,000
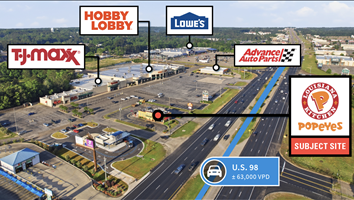

- $15,262,000