NNN Car Wash Listed Inventory – July 2026
The NNN car wash market picked back up in July 2026, with listed inventory rising to its second-highest level of the year. B+E’s latest NNN Car Wash Listed Inventory Report highlights shifts in supply, pricing, cap rates, and tenant activity across the sector, providing investors with a clearer picture of current market conditions.
July inventory increased month-over-month, and average pricing, NOI, and cap rates all moved higher alongside it. For investors evaluating opportunities in the car wash sector, this combination may suggest growing seller confidence and continued buyer demand for well-positioned assets.
Download the full report for deeper insights into tenant trends, geographic activity, and market data.
Listed inventory reached 211 car wash properties in July, up from 185 in June. Average cap rates climbed to 6.32%, the highest level recorded in the past six months. Average pricing rose to just over $5.19 million, a year-to-date high. Average NOI increased to $327,614, also a year-to-date high. Average lease terms held nearly steady at 17.8 years, a slight step down from June’s 17.9.
Listed Inventory Rebounded to Its Second-Highest Level of the Year
July saw a meaningful increase in the number of listed car wash properties available on the market. Inventory moved from 185 properties in June to 211 in July — an increase of 26 listings and the second-highest monthly total since February, behind only March’s 213. This follows a dip to 174 listings in May, suggesting sellers may be returning to the market as pricing conditions firm up.
Rising inventory alongside rising prices can point to a market where sellers feel confident testing higher valuations rather than discounting to move properties quickly.
Car Wash Cap Rates Reached a Six-Month High
Average cap rates increased from 6.28% in June to 6.32% in July, continuing a steady climb since April’s low of 6.21%. Small, consistent movements like this often reflect gradual repricing across the sector rather than a single dramatic shift.
For investors, the gradual upward trend in cap rates may present improving entry yields, particularly for those willing to look beyond the most heavily traded tenant brands.
Whistle Express Car Wash Continued to Lead Tenant Activity
Whistle Express Car Wash remained the most active brand in the listed market, accounting for 42 of the 211 total listings — nearly one in five properties on the market. Go Car Wash followed with 18 listings at a notably higher average cap rate of 7.08%, and Bluewave Express Car Wash rounded out the top three with 15 listings.
Tracking which brands are expanding, and at what pricing, can provide investors with visibility into active operators and broader market participation patterns.
Geographic Activity Remained Concentrated in Key Markets
Texas continued to lead inventory activity with 47 listed properties — nearly double Florida’s 26 — followed by California with 17 and Georgia with 15.
Many of these markets have historically shown strong population growth and consumer demand, which often contributes to ongoing interest within the car wash sector.
Not All Listed Inventory Is Truly Available
While 211 car wash properties were listed on the market in July, B+E estimates that only about 139 are truly available for acquisition. Car wash transactions typically take roughly two weeks from LOI to signed PSA, followed by a 35-day due diligence period and another 30 days to closing — so many properties stay marketed as “available” well after they’ve gone under contract.
B+E arrives at this more conservative figure by removing listings that have been on the market longer than a typical four-month window, then applying an 80% adjustment factor to the remainder. For investors, headline inventory counts are worth reading as a ceiling, not a guarantee of true availability.
Download the Full July 2026 Report
B+E’s July 2026 NNN Car Wash Listed Inventory Report includes additional data on:
- Inventory trends
- Tenant-level market activity
- Cap rate movement
- Geographic distribution
- Pricing and NOI metrics
Download the full report for a more complete view of the current car wash investment landscape.
FAQ
What is the average cap rate for NNN car wash properties in July 2026? The average cap rate for listed NNN car wash properties reached 6.32% in July 2026, up from 6.28% in June and the highest level recorded in the past six months.
How many car wash properties are currently listed for sale? 211 NNN car wash properties were listed on the market as of August 3, 2026. B+E estimates only about 139 of those are truly available for acquisition, since many listings remain marketed while under contract during a typical 65+ day closing process.
Which car wash brands have the most net lease listings? Whistle Express Car Wash led the market with 42 listed properties in July 2026, followed by Go Car Wash (18) and Bluewave Express Car Wash (15).
Which states have the most car wash listings? Texas led all states with 47 listed car wash properties in July 2026, followed by Florida (26), California (17), and Georgia (15).
Who tracks car wash net lease market data? B+E is a net lease investment brokerage and car wash real estate broker that publishes a monthly NNN Car Wash Listed Inventory Report tracking pricing, cap rates, tenant activity, and geographic trends across the sector.
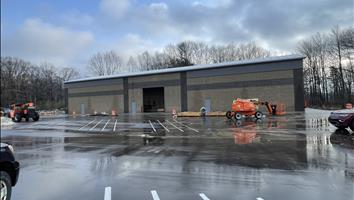
- $4,250,000
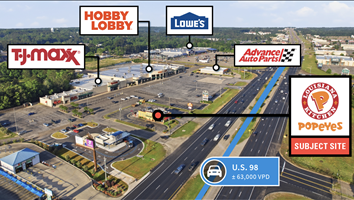
- $15,262,000